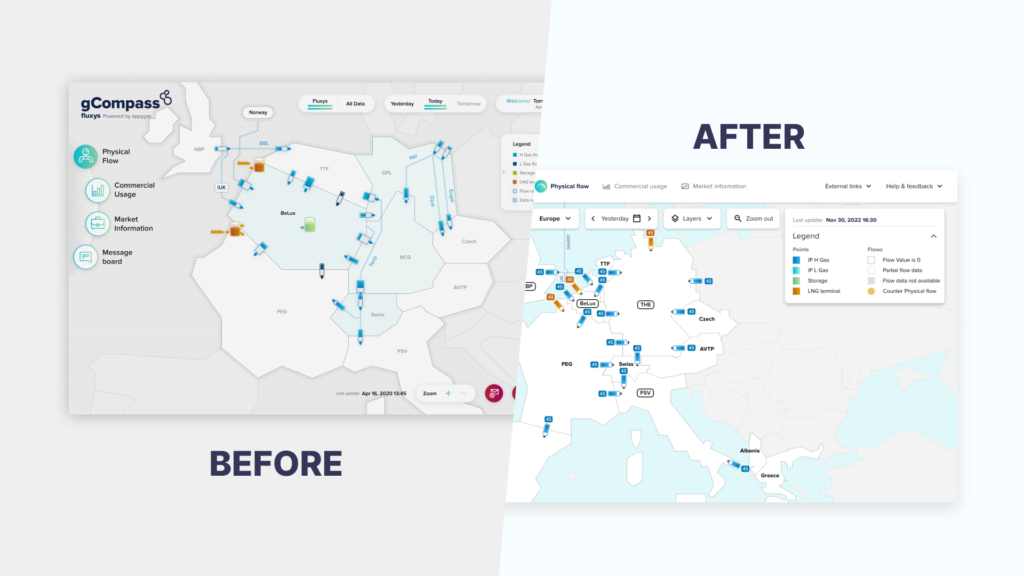
Gcompass is a map application designed and developed by Fluxys, created to provide an instant overview of the gas network state, particularly in Western Europe. Gcompass offers a variety of interesting features such as routes for gas distribution, gas reserves, available markets, etc., catering to different stakeholders including civil engineers, commercial entities, and more. This application is used for internal needs such as LNG price research, network state checks, obtaining a global view, and arbitrage. It is available for both mobile and desktop platforms.
The Problem
The map which the client required does not represent Europe accurately, so they want to redesign the existing map with a new one which is more accurate, cleaner, and has more features that focus on user experience.
The Solution
Referring to those problems, the client and we discussed to find a solutions of them:
Renew the whole application to be cleaner and pay more attention to UX.
Replace the map which is more suitable and accurate.
Only use the features that are really needed.
Once a solutions are found, It is time for us to redesign as client requested. The changes that we apply to. Tha changes that we applied are:
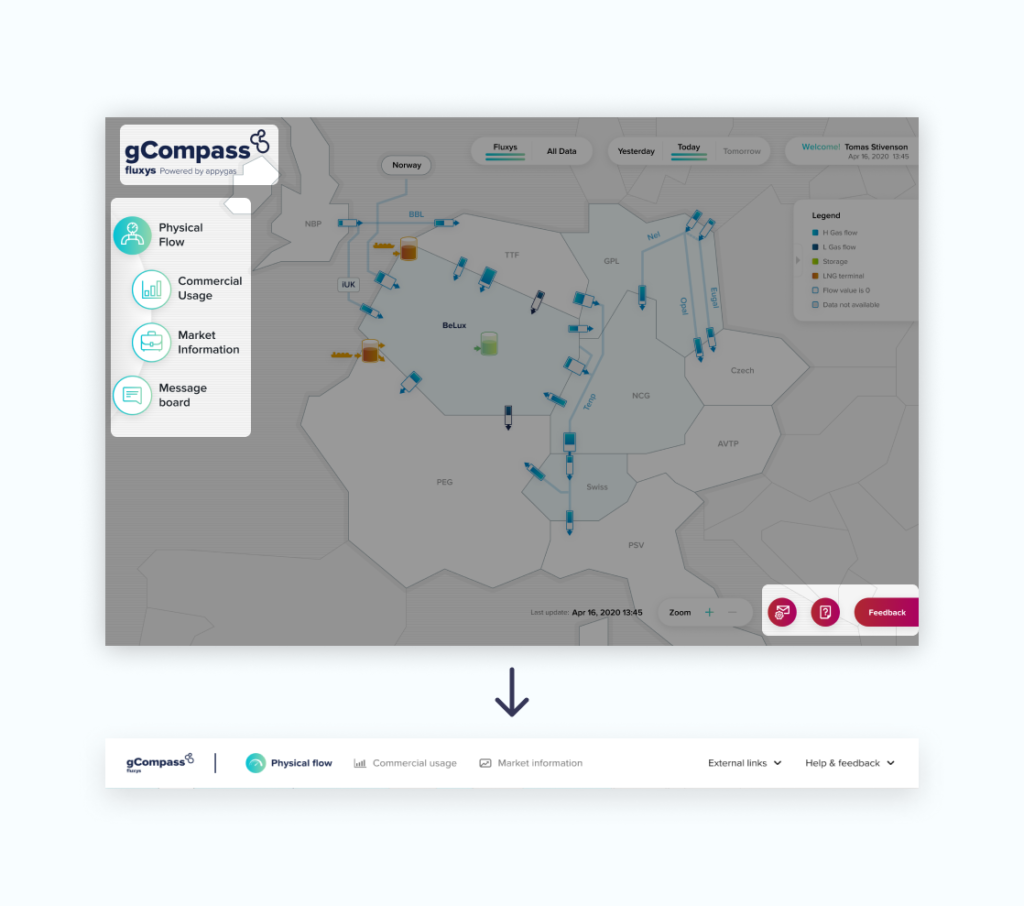
In the previous design there was no navigation which concentrated in one place, so we create a Navbar to focus on top-level destinations that should be accessible from anywhere in the app.
From the picture above, can be seen that we compile three components as a part of the navbar for reason that they are a top-level of destination that should be accessible from anywhere in the application.There are some changes that we do, such as replacing the navigation icon into a new icon, we also change the External Links and Help & Feedback sections into text to make it easier for user to understand.
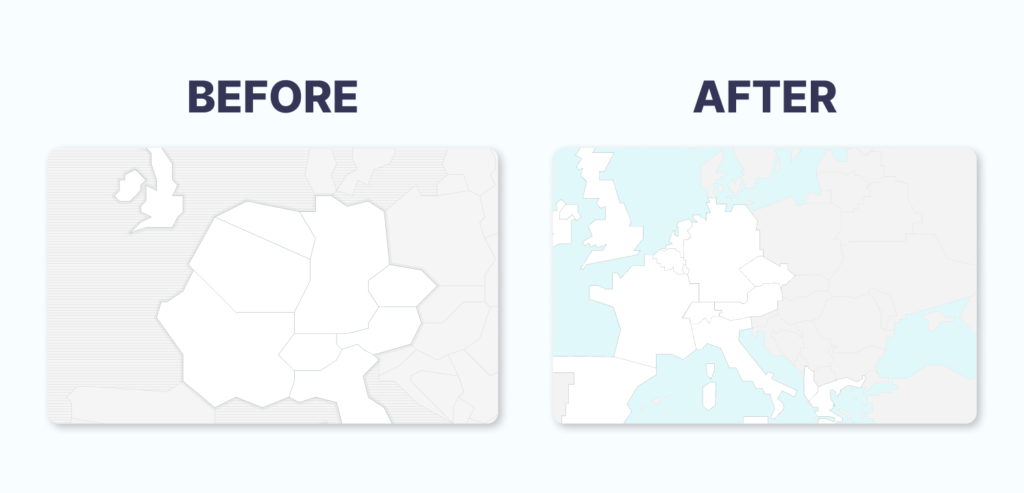
2. After the navbar was created, our client want to replace the existing map with the one which more realistic. So here is the result Before and After of the map that we discussed together with client.
White areas on the map is represent countries with active zone and included in market. Beside that we have gray area which represents an inactive zone and not included in market. Finally there’s a blue areas which is a sea.
Next, we redesign the map icon to be more compact and accordance with the map which was made before. The interesting thing about this new icon is, it has emphasis on color gradation.
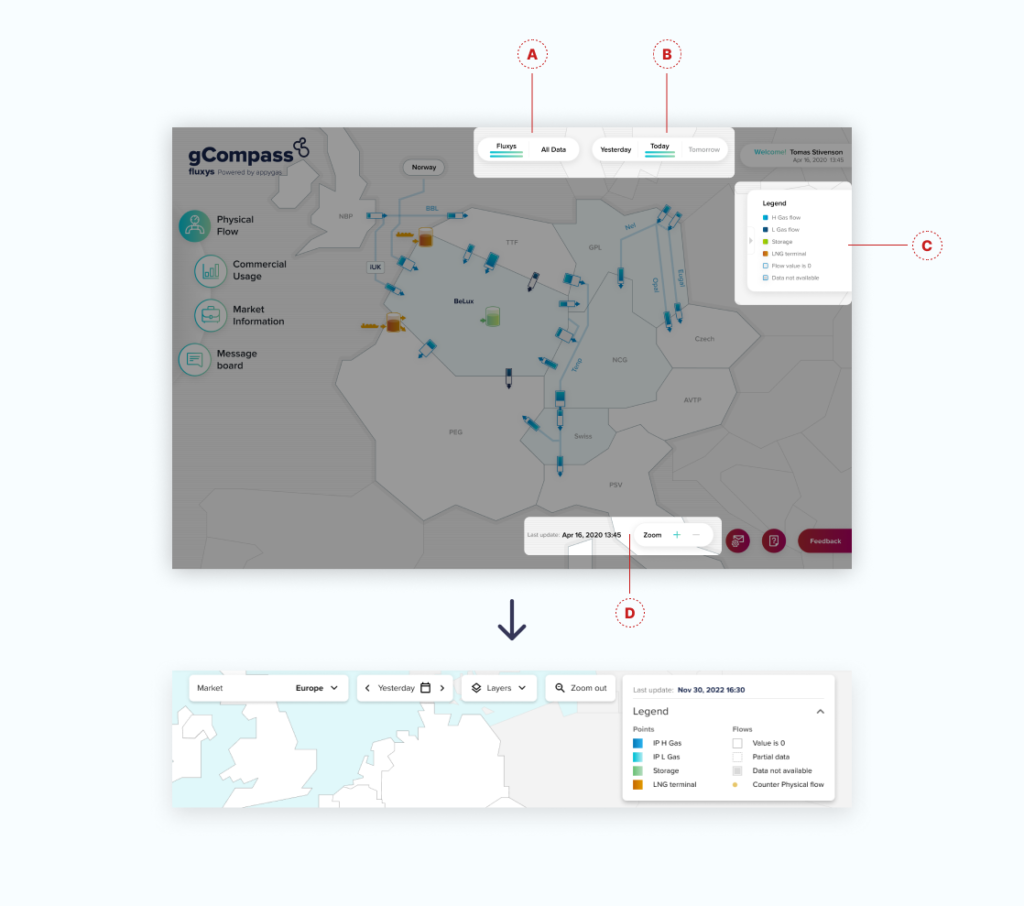
3. The last, after the map and its elements are created, it’s time to redesign the features that will support Gcompass application.
The picture above is a result of discussion with our client which showing all features that will remain in use:
The first feature has a function to see data that we display on the map. From the previous design which displayed all datas and Fluxys elements, we summarized them by using a dropdown button to give the design a tight impression and then rename it Layers.
The second feature has a function to view data based on a certain time. For example in the picture above, it is showing the data of today or yesterday wheres on previous design, it is showing the data from any time like yesterday and tomorrow. We summarize it by using buttons with a slider system and adding a new feature, namely a calendar so that users can view data not only for past the day but also according to their needs.
The third feature is all the information on the map. On the previous design it looked tiny so we decided to upsize it so that all the information could be entered into this feature. We also combine the time from the last update feature into this new feature to help users see it easier.
The fourth feature is the zoom feature which has a function of enlarging and reducing the map by 3 zoom levels.
The last feature is a new feature to view data by market, starting from a map that showing European market to only focusing on showing one country.
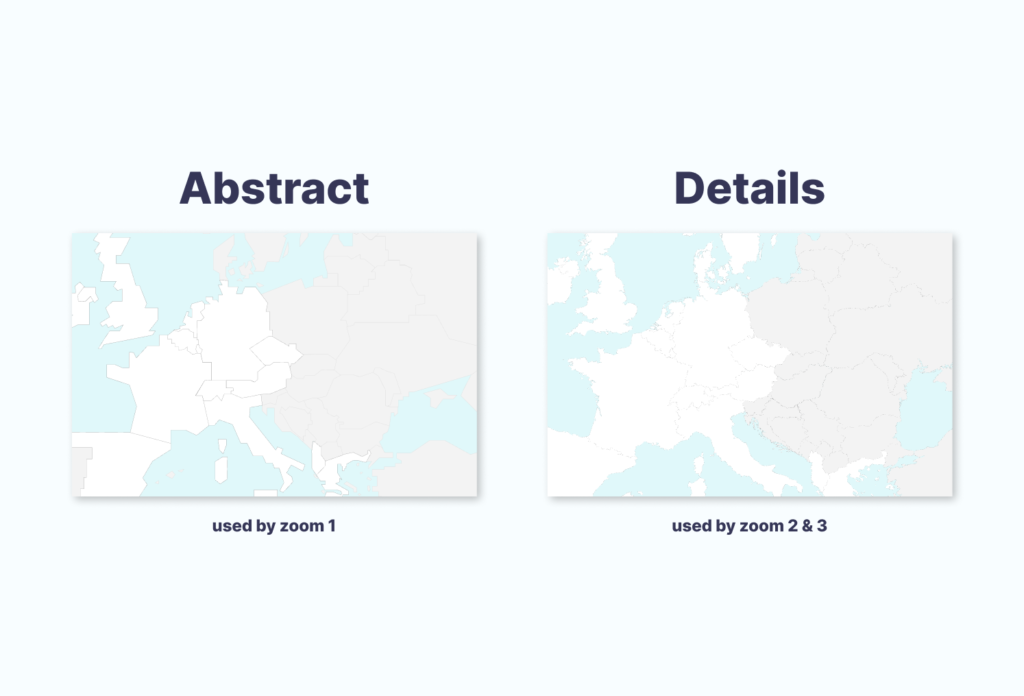
After all these problems are resolved, it’s time for us to enter the elements into the map according to business needs. In the application that we know above, there is a zoom feature that has 3 zoom levels, each zoom level has different elements, the greater the zoom level, the information and maps displayed will be more detailed. Owing to that fact, we need map which more detailed compare to the previous one. As can be seen below:
Next, let’s look at the differences between zoom levels 1,2 and 3 and the elements they display.
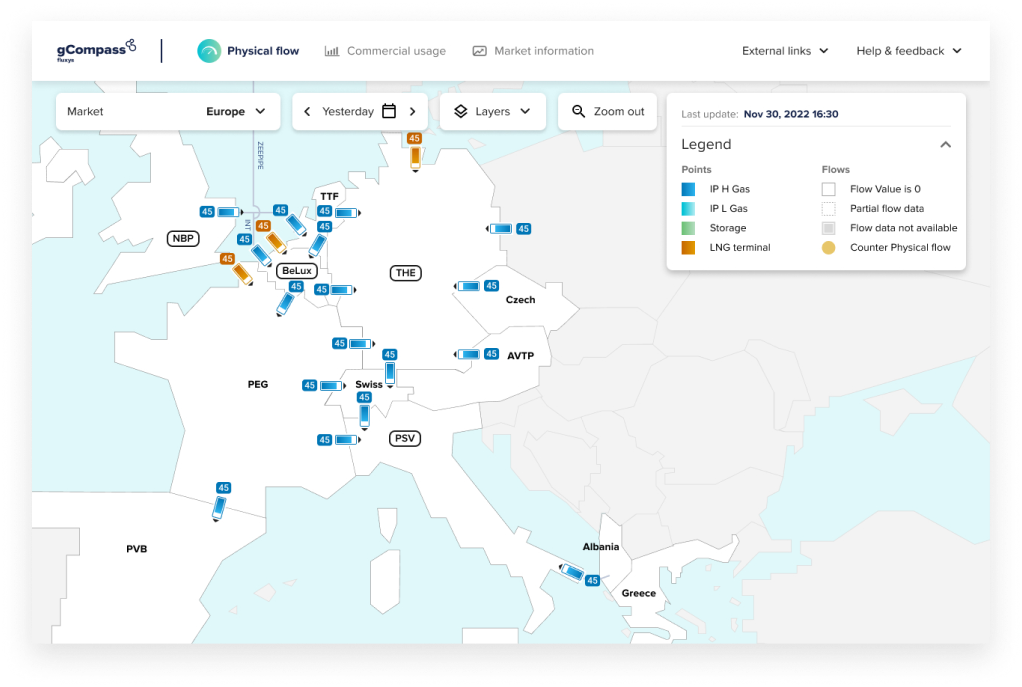
a. Zoom 1 displays data from European active zones using an abstract map.
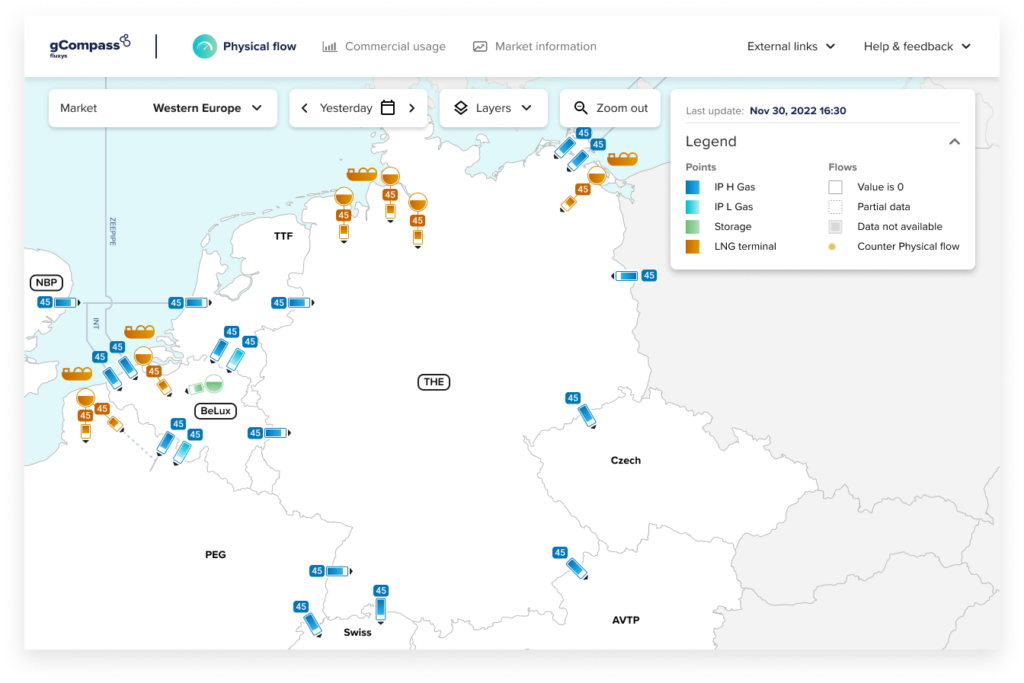
b. Zoom 2 displays active zone data from Western Europe with more detailed elements and uses a detailed map.
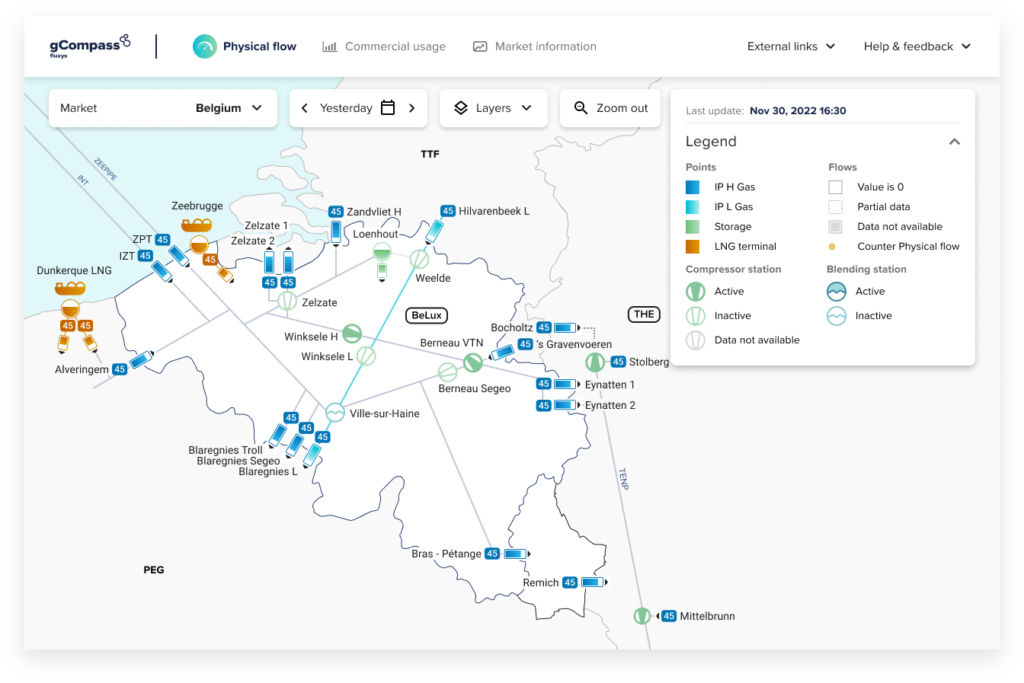
c. Zoom 3 displays data from the selected country zone, for example in this picture we choose Belgium. The information from Belgium is more detailed and focused compare with the previous zoom level.
Finally, after designing, it’s time to do the prototype. The video below is showing the result of the prototype from the design above.
What a fascinating project to create a system that is integrated by many types of users. That’s all for this case study, thank you.